| HTML |
|---|
<div style="background-color: yellow; border: 2px solid red; margin: 4px; padding: 2px; font-weight: bold; text-align: center;">
This page was moved to <a href="https://github.com/CERTCC/certfuzz/blob/main/doc/Effective%20use%20of%20CERT%20BFF%20Tutorial.pdf">https://github.com/CERTCC/certfuzz/blob/main/doc/Effective%20use%20of%20CERT%20BFF%20Tutorial.pdf</a>
<br>
Click in the link above if you are not automatically redirected in 10 seconds.
</div>
<meta http-equiv="refresh" content="10; URL='https://github.com/CERTCC/certfuzz/blob/main/doc/Effective%20use%20of%20CERT%20BFF%20Tutorial.pdf'" />
|
| Table of Contents |
|---|
Overview
The default configuration of CERT BFF will find as many unique crashes as possible. The simplest way to use BFF is to start a fuzzing campaign, and when the results start rolling in, run tools/drillresults.py to check for easily-exploitable crashes. If you get a score of a 10 or a 5, you'll probably have a relatively-easy time creating a proof-of-concept exploit (PoC). Luckily, BFF has some features that can help take the guesswork out of determining which crashes are exploitable.
Default use of BFF
After configuring BFF to correctly (and effectively) run your target application, you should eventually see some crashing test cases. For example, here is drillresults.py output from a brief fuzzing campaign against a target application:
| Code Block | ||||
|---|---|---|---|---|
| ||||
0x2cb0f334.0x4bb3d30a - Exploitability rank: 10
Fuzzed
 file:
results\TARGET\crashers\EXPLOITABLE\0x2cb0f334.0x4bb3d30a\sf_7d7bb89974213e3de4d2b9289fa0caba-4257-0x00130000-minimized.EXT
exception 0: ExceptionHandlerCorrupted accessing 0x00130000
0040eaec f3a5            rep movs dword ptr es:[edi],dword ptr [esi]
Code executing in: image00400000
exception 1: ReadAVonIP accessing 0x6e4e99dd   *** Byte pattern is in fuzzed file! ***
6e4e99dd ??              ???
Instruction pointer is not in a loaded module!
exception 2: ReadAVonIP accessing 0x6e4e99dd   *** Byte pattern is in fuzzed file! ***
6e4e99dd ??              ???
Instruction pointer is not in a loaded module!
exception 3: ReadAVonIP accessing 0x6e4e99dd   *** Byte pattern is in fuzzed file! ***
6e4e99dd ??              ???
Instruction pointer is not in a loaded module!
exception 4: ReadAVonIP accessing 0x6e4e99dd   *** Byte pattern is in fuzzed file! ***
6e4e99dd ??              ???
Instruction pointer is not in a loaded module!
exception 5: ReadAVonIP accessing 0x6e4e99dd   *** Byte pattern is in fuzzed file! ***
6e4e99dd ??              ???
Instruction pointer is not in a loaded module!
exception 6: ReadAVonIP accessing 0x6e4e99dd   *** Byte pattern is in fuzzed file! ***
6e4e99dd ??              ???
Instruction pointer is not in a loaded module!
|
Let's look at a few parts of this output:
0x2cb0f334.0x4bb3d30a - Exploitability rank: 10
This indicates the crash hash reported by Microsoft !exploitable, as well as a relative rank of the crash exploitability. If the rank number is low, then it is likely that the crash is easily exploitable. drillresults.py uses some heuristics to determine the chances of gaining control of the instruction pointer.
exception 0: ExceptionHandlerCorrupted accessing 0x00130000
This is the first exception encountered in the debugger. In this case, the faulting address and the !exploitable categorization both indicate that we're dealing with a stack buffer overflow. That is, the address 0x00130000 is first address beyond the end of the default stack address on a Windows XP system, and ExceptionHandlerCorrupted is the !exploitable categorization that the structured exception handler (SEH) has been overwritten.
exception 1: ReadAVonIP accessing 0x6e4e99dd *** Byte pattern is in fuzzed file! ***
When an exception is encountered with a target application on the Windows platform, BFF will see what happens when code execution is continued. When an exception is encountered with a Windows application, an application may attempt to handle the exception, using the code pointed to by the SEH. In the case of this crash, you will note that exception 0 indicated that the SEH was overwritten. What happens when you attempt to continue execution when the SEH has been overwritten? Windows may attempt to execute code using an address pointer that was just overwritten. In this case, Windows is attempting to execute code at the exception faulting address (EFA) of 0x6e4e99dd. And it just happens that the byte pattern 0xdd994e6e exists in the fuzzed file (byte order reversed for little-endian architecture).
Assuming it isn't simply a coincidence that the EFA pattern matches a pattern in our fuzzed file, we should be able to modify those four bytes in our fuzzed file, and we can demonstrate control of the instruction pointer.
Brute Forcing the EFA
The example above is pretty straightforward. The crash gets a good score because the EFA isn't near NULL, and there's a matching pattern in my fuzzed file. But what if the EFA pattern did still come from my fuzzed file, but just by dumb luck was a value near NULL? drillresults.py wouldn't rank it quite as high.
String Minimization
BFF includes the ability to do "string minimization." The default minimization that happens with BFF is to make the fuzzed file as close as possible to the seed file, but still have it crash in the same way. Further details are available in the paper: Well There’s Your Problem: Isolating the Crash-Inducing Bits in a Fuzzed File. String minimization, on the other hand, attempts to make the fuzzed file as close as possible to a string of ASCII characters. In particular, either the Metasploit string or a string of lowercase 'x' characters (hex 0x78). Please see the CERT/CC blog entry Visualizing CERT BFF String Minimization for more details.
The most straightforward way to utilize string minimization with BFF is when fuzzing is complete, take an interesting crash (e.g. one with a good drillresults.py score) and run tools/minimize.py with the -s option. This will turn as many bytes of your crashing testcase as possible into the Metasploit string pattern. It is usually a good idea to use the -k (keep other crashers) and -f (keep same faulting address).
String Minimization During Fuzzing
BFF includes the ability to perform string minimization during fuzzing. For every unique crash encountered, instead of minimizing the crashing testcase to the seed file, BFF will minimize the crashing testcase to a string of ASCII 'x' characters. The option is enabled with the following configuration item in bff.yaml:
| Code Block | ||||
|---|---|---|---|---|
| ||||
runoptions:
minimize: string |
Factoring the Faulting Addresses into the Crash Hash
BFF also has an option to treat unique EFAs as unique crashes. On the Windows platform, this is done by simply appending the EFA pattern onto the !exploitable crash hash. For example, in the crash at the beginning of this page, the crash hash of 0x2cb0f334.0x4bb3d30a will be reported as 0x2cb0f334.0x4bb3d30a.6e4e99dd if the following option is set:
| Code Block | ||||
|---|---|---|---|---|
| ||||
runoptions:
keep_unique_faddr: True |
On non-Windows platforms supported by BFF, the crash identifier is generated using an MD5 hash, so the faulting address isn't obvious based solely on the directory name.
Enabling the Debug Heap
The release version of BFF 2.8 disables the debug heap by default. The original motivation for this was to more closely represent the non-debugged execution of the target application. This appeared to make sense in the Windows XP days, as on that platform one could make a pretty reliable proof-of-concept exploit for a crash that involved the Windows heap. On modern Windows platforms, heap-related crashes can have a high amount of variability in the crash properties, even among seemingly-identical invocations of the target application. We can avoid these variations in heap-related crashes by enabling the following feature in bff.yaml:
| Code Block | ||||
|---|---|---|---|---|
| ||||
debugger:
debugheap: True |
Combining These Options
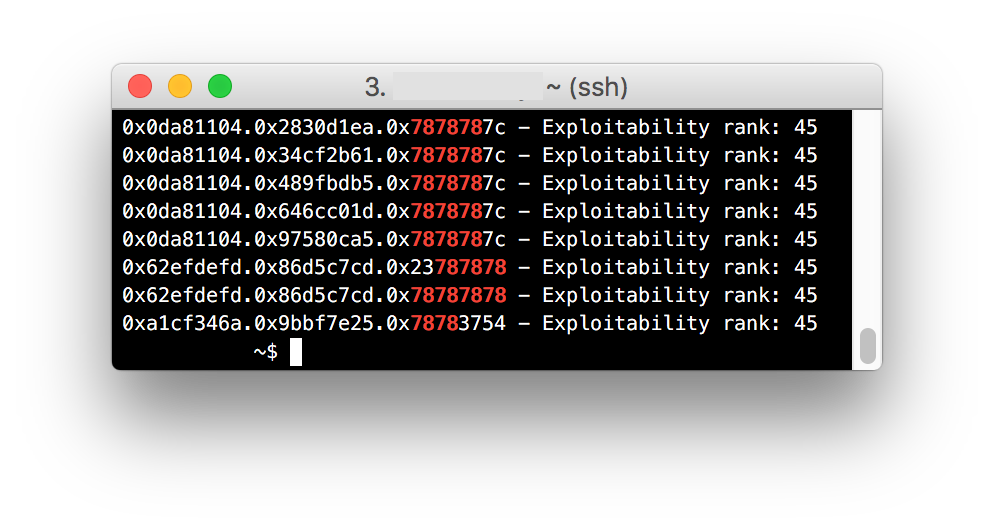
When the above three options are all used, BFF is put into a mode where it becomes more obvious which crashes have an EFA that is directly influenced by the bytes in the fuzzed file. By looking for EFA patterns that have 0x78 in them, you can find crashes where you may be able to influence the code being executed. For example:
Here are multiple crashes where the faulting address appear to be influenced by the 'x' bytes in our fuzzed file. Again, to put BFF into this mode, use the following three options:
| Code Block | ||||||
|---|---|---|---|---|---|---|
| ||||||
 runoptions:
    minimize: string
    keep_unique_faddr: True

debugger:
debugheap: True |
Assuming you have Cygwin installed on your Windows fuzzing VM, crashes that appear to have a controllable EFA can be found with these commands:
| Code Block | ||||||
|---|---|---|---|---|---|---|
| ||||||
 C:\BFF>find . -name "*78*msec" | grep --color 78
fuzz@UbuFuzz:~$ find ~ -name "*.gdb" | xargs egrep "^si_addr.*78*" | grep --color 78 |
Digging Into BFF Results
drillresults.py is a simple script to tease out the crashes that are most likely to give you control of the instruction pointer. But with the above two options set, we can get better insight into which crashes are interesting.
Warm-up Round: Paint Shop Pro 5.01
When testing out fuzzing strategies, it can be effective to target old software. The assumption here is that older software is more likely to crash when fuzzed. This assumption turns out to be quite true:
| Code Block | ||||
|---|---|---|---|---|
| ||||
0x2cb0f334.0x4bb3d30a - Exploitability rank: 10
Fuzzed
 file:
results\TARGET\crashers\EXPLOITABLE\0x2cb0f334.0x4bb3d30a\sf_7d7bb89974213e3de4d2b9289fa0caba-4257-0x00130000-minimized.EXT
exception 0: ExceptionHandlerCorrupted accessing 0x00130000
0040eaec f3a5            rep movs dword ptr es:[edi],dword ptr [esi]
Code executing in: image00400000
exception 1: ReadAVonIP accessing 0x6e4e99dd   *** Byte pattern is in fuzzed file! ***
6e4e99dd ??              ???
Instruction pointer is not in a loaded module!
exception 2: ReadAVonIP accessing 0x6e4e99dd   *** Byte pattern is in fuzzed file! ***
6e4e99dd ??              ???
Instruction pointer is not in a loaded module!
exception 3: ReadAVonIP accessing 0x6e4e99dd   *** Byte pattern is in fuzzed file! ***
6e4e99dd ??              ???
Instruction pointer is not in a loaded module!
exception 4: ReadAVonIP accessing 0x6e4e99dd   *** Byte pattern is in fuzzed file! ***
6e4e99dd ??              ???
Instruction pointer is not in a loaded module!
exception 5: ReadAVonIP accessing 0x6e4e99dd   *** Byte pattern is in fuzzed file! ***
6e4e99dd ??              ???
Instruction pointer is not in a loaded module!
exception 6: ReadAVonIP accessing 0x6e4e99dd   *** Byte pattern is in fuzzed file! ***
6e4e99dd ??              ???
Instruction pointer is not in a loaded module!
|
This looks quite promising! The first thing we will do is take this crash and do a Metasploit string minimization on it:
| Code Block | ||||
|---|---|---|---|---|
| ||||
 C:\BFF>tools\minimize.py -s -k -f
results\psp501-x\crashers\EXPLOITABLE\0x5b334a69.0xae9fae70.0x58787878_0xe6b39f75.0x28e42113.0x7878787c\sf_1f25044e863e7b1bef5ae42d968fe27f-siv0qq-0x58787878.wpg |
After this is done, we will have a number of files in the minimizer_out directory. The one I'm interested in has -min-mtsp appended to the file name. We can run tools\repro.py to reproduce the crash:
| Code Block | ||||
|---|---|---|---|---|
| ||||
 C:\BFF>tools\repro.py
minimizer_out\sf_1f25044e863e7b1bef5ae42d968fe27f-siv0qq-0x58787878-0x58787878-min-mtsp.wpg -p immunitydebugger |
Assuming that immunitydebugger.exe is in our PATH, this will reproduce the newly-string-minimized crash in Immunity Debugger:
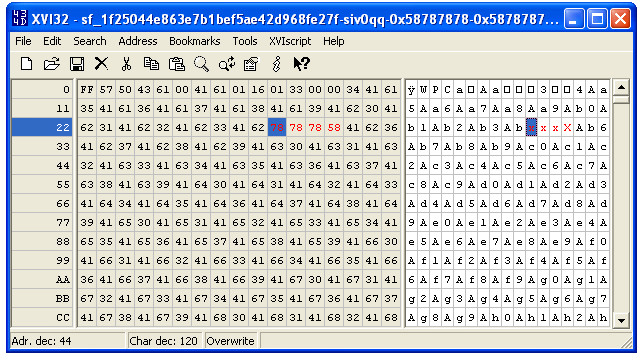
Here we see that we have control of the instruction pointer, and we have some Metasploit pattern bytes at our disposal on the stack. If we open our newly-created file in a hex editor, we can see the bytes that control the instruction pointer. Many of the other bytes are the Metasploit pattern.
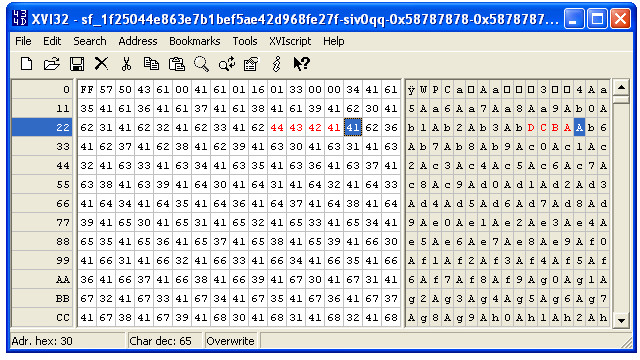
We now take those bytes and set them to a pattern that we recognize. I use 0x44434241, which is ASCII ABCD in little-endian format, and save the file as abcd.wpg.
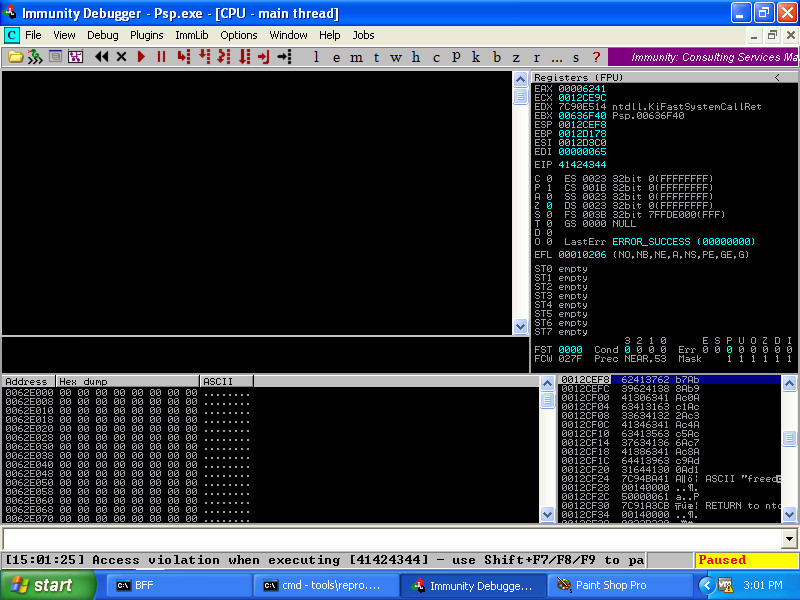
Finally, we run tools\repro.py on minimizer_out\abcd.wpg:
Here we have demonstrated control of the instruction pointer, and we have some stack space at our disposal. It is pretty easy to go from here to something that launches calc.exe when the image is opened, for example. By default, there is no DEP, ASLR, SafeSEH, or any of the other exploit mitigations at play with this application, since the target application is so old.
Digging Deeper: A WRITE4
Other old target that I looked at was FastStone MaxView 1.6. After a short amount of fuzzing, this crash came up:
| Code Block | ||||
|---|---|---|---|---|
| ||||
0x3eda38dc.0x5ce6d1f9.0x00cc0000_0x3eda38dc.0x3e7d918a.0x7878787c_0x3eda38dc.0x7095d__ - Exploitability rank: 50
Fuzzed
 file:
results\maxview-x\crashers\EXPLOITABLE\0x3eda38dc.0x5ce6d1f9.0x00cc0000_0x3eda38dc.0x3e7d918a.0x7878787c_0x3eda38dc.0x7095d__\sf_540cee04253030f363f7902b6edc732d-aikdpf-0x00cc0000.tga
exception 0: WriteAV accessing 0x00cc0000
004fd19c 880416          mov     byte ptr [esi+edx],al      ds:0023:00cc0000=??
Code executing in: image00400000
exception 1: WriteAV accessing 0x7878787c   *** Byte pattern is in fuzzed file! ***
004022c2 894104          mov     dword ptr [ecx+4],eax ds:0023:7878787c=????????
|
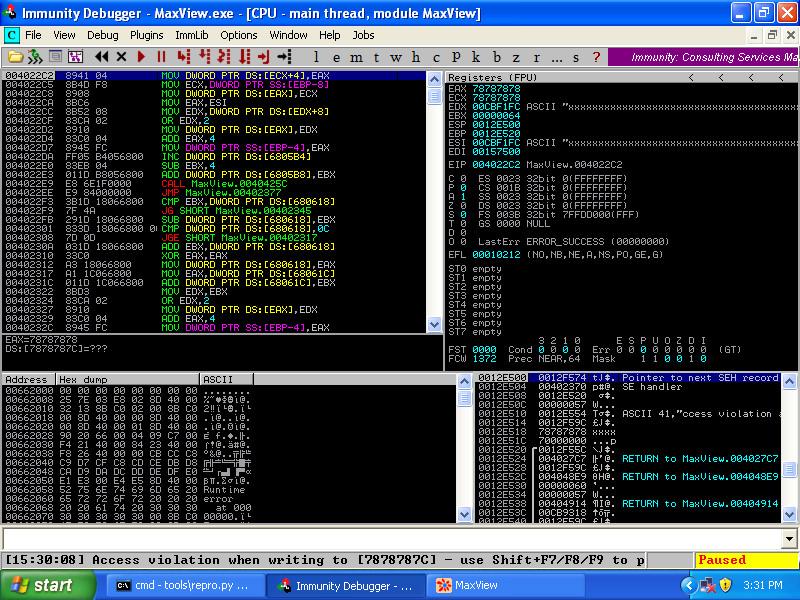
Here we have a crash that is ranked as a 50. What makes this crash interesting is that we have a WriteAV exception, and the faulting address looks to be under our control (due to the 78's). Let's look in Immunity Debugger:
Here we can see that MaxView is attempting to write the value in EAX into the location designated by ECX+4. By looking at the registers EAX and ECX, we can see that we control both of them. This is a clear indication that we can write an arbitrary dword to an arbitrary location. This is known as an exploitable write-what-where vulnerability, or a "Write4."
Exploitability on Linux
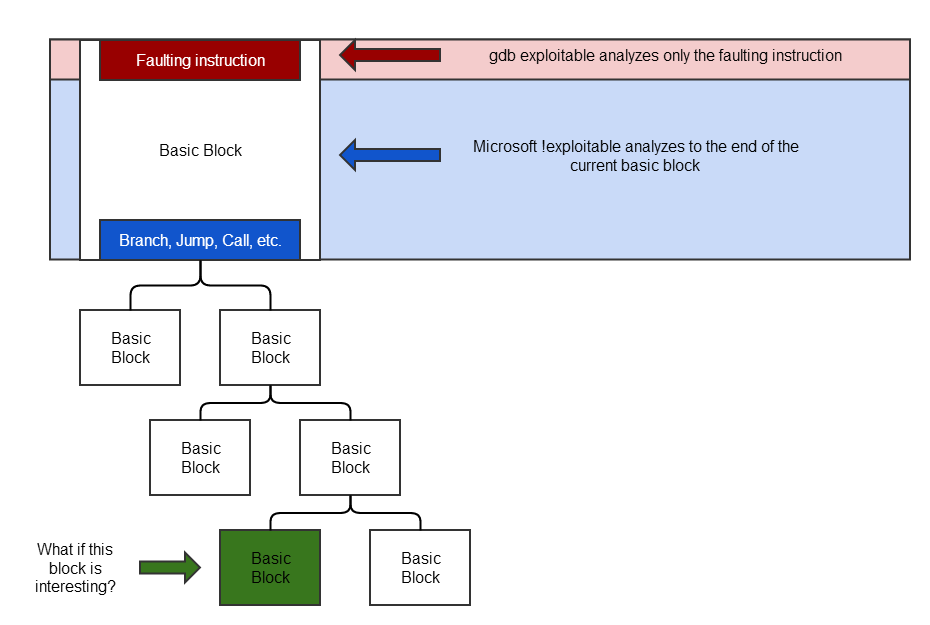
Getting insight into whether the EFA is controlled has an even greater benefit on the Linux platform. This is mostly due to the fact that the exploitable gdb plugin that BFF uses only looks at the current instruction when determining exploitability of a crash. The Microsoft !exploitable plugin, on the other hand, considers the entirety of the current basic block. Since drillresults.py relies on the exploitability determination of the gdb exploitable plugin, this means that drillresults.py may overlook some crashes that could be interesting.
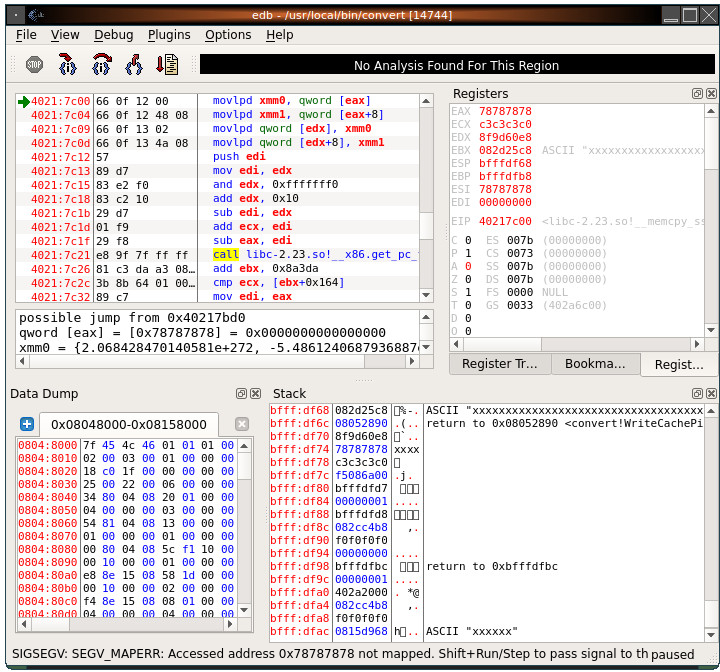
Here we are reproducing a crash in the default UbuFuzz campaign of ImageMagick that indicates control of the EFA. Using tools/repro.py -e, which uses the edb debugger, we get:
Here we can see that the faulting instruction is dereferencing EAX to load a qword of data into XMM0. XMM1 is also populated with the bytes at EAX + 8. The instruction immediately following is:
movlpd qword [edx], xmm0
This instruction will take the contents in xmm0 and write them to the location that EDX points to. What we can conclude from this is that the crashing testcase will take bytes under our control and then write them to a location. It's not immediately clear whether we can control where EDX points, but we already know more than what the gdb exploitable plugin told us.
This case brings up an interesting aspect about crashes where the EFA can be controlled: If the EFA of a crash can be controlled, this means that we have further control of what the target application does.
Proceeding Past the Initial Exception
When fuzzing with BFF, the tool used for exploitability determination can affect what crashes look to be interesting. Microsoft !exploitable traces taint throughout the rest of the current, faulting basic block. The gdb exploitable tool only looks at the faulting instruction. The important thing to realize is that neither technique is sufficient to properly determine exploitability of a crash.
...
If we know that we control the EFA of the faulting instruction, we know that we can cause the code to execute beyond the end of the current basic block. Depending on what the code does beyond the end of the current basic block, an UNKNOWN crash can turn out to be EXPLOITABLE.
Advanced BFF: Turning an UNKNOWN into an EXPLOITABLE
Using the above technique of enabling in-campaign string minimization along with considering the EFA as part of the crash hash, we find an UNKNOWN crash in Microsoft Office 2003 Excel:
Why does Microsoft !exploitable treat this as an UNKNOWN? Remember that the !exploitable visibility is limited to the current basic block. Specifically:
| Code Block | ||||
|---|---|---|---|---|
| ||||
300F57FD   . F646 06 04     TEST BYTE PTR DS:[ESI+6],4
300F5801   . 8B45 10        MOV EAX,DWORD PTR SS:[EBP+10]
300F5804   . 8975 F0        MOV DWORD PTR SS:[EBP-10],ESI
300F5807   . 8945 F4        MOV DWORD PTR SS:[EBP-C],EAX
300F580A . 75 10 JNZ SHORT EXCEL.300F581C |
We have an exception on the TEST instruction, and the end of the basic block is a conditional jump: JNZ. By configuring BFF to perform string minimization during fuzzing and also to also factor the EFA into the uniqueness of a crash, we have more insight into whether this crash is interesting. We know that we can control the EFA due to the presence of the 0x78 bytes. What if we take the exception and turn it into something that does not fault? That is, in our fuzzed file, we change the 0x78787878 pattern into an address that will allow TEST BYTE PTR DS:[ESI+6],4 to succeed.
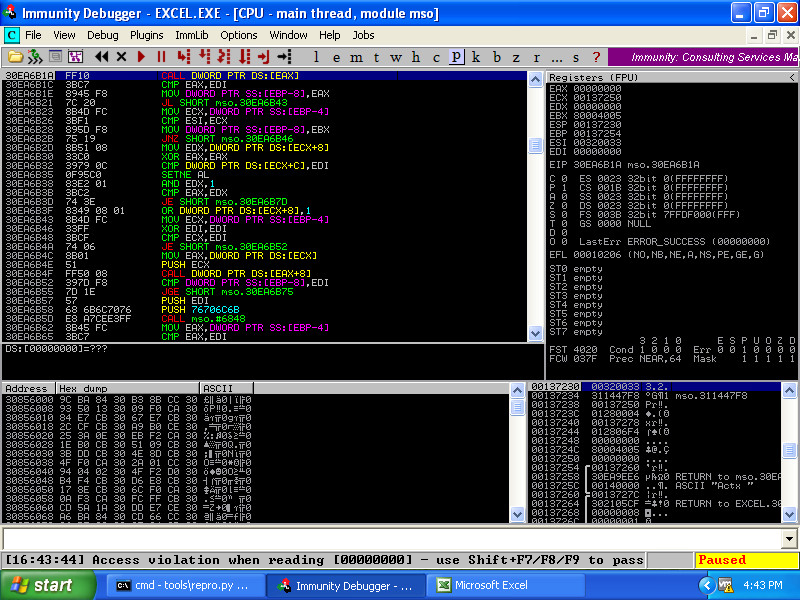
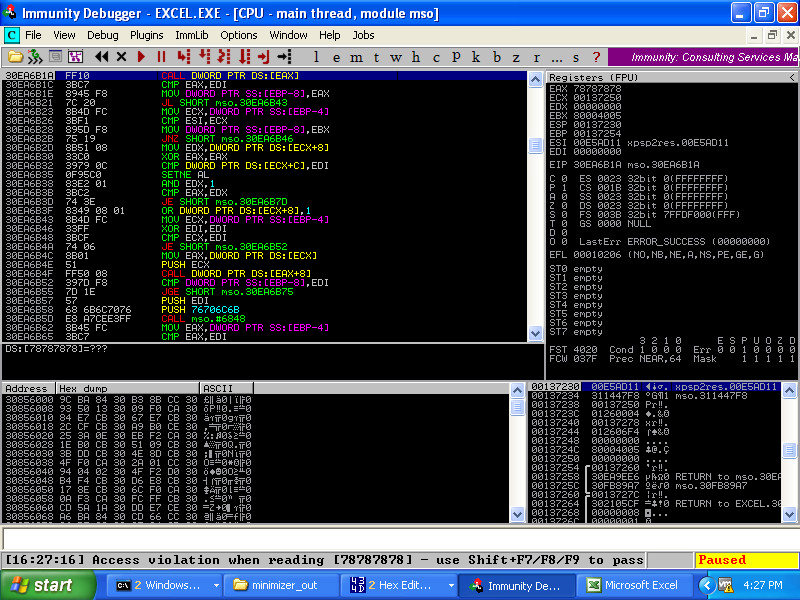
If we're not using something like a symbolic execution engine, the experimentation of what happens after the original fault can take a bit of trial-and-error testing. First we simply take a memory address that can be dereferenced, and change the 0x78787878 pattern in our fuzzed file to this address. Reproducing the crash in Immunity Debugger gives us:
Well now this is interesting! We have an access violation on a CALL instruction. This is reported as PROBABLY_EXPLOITABLE by !exploitable:
| Code Block | ||||
|---|---|---|---|---|
| ||||
30ea6b1a ff10            call    dword ptr [eax]      ds:0023:00000000=????????
0:000> !exploitable
!exploitable 1.6.0.0
*** ERROR: Symbol file could not be found.  Defaulted to export symbols for Excel.EXE -
Exploitability Classification: PROBABLY_EXPLOITABLE
Recommended
 Bug Title: Probably Exploitable - Read Access Violation on Control Flow
 starting at mso!Ordinal6543+0x0000000000001eda
(Hash=0x3d855f61.0xa61eef28)
Access violations near null in control flow instructions are considered probably exploitable.
0:000> |
We'd like to do better than that, though. Use your favorite tracing techniques and determine how the EAX register is set before the CALL. Looking at the Excel code, we determine that EAX is populated by dereferencing the pointer specified by our original exception twice. By using a pointer-to-a-pointer memory location as our address, we can now demonstrate full control of the CALL instruction:
Jackpot! We've started with an UNKNOWN crash, and we now have a demonstrably EXPLOITABLE crash. All of this was made possible with the following three BFF options used together:
| Code Block | ||||||
|---|---|---|---|---|---|---|
| ||||||
runoptions:
    minimize: string
    keep_unique_faddr: True

debugger:
debugheap: True |
...
